The network is running slow conundrum
..or maybe you’re not measuring the right things?
We've all heard it shouted across the office, “the network’s running slow again”. It seems to be the catch all for many and all IT issues, but invariably the network team are the ones who start the process of solving it.
The Starting Point
The true starting point is that data is arriving at the user’s PC slowly - which may or may not be a network issue - but the network seems to cop it anyway. Part of the issue is that it sits in the middle; Servers & Applications at one end and PCs at the other, with both placing the blame on the connection in between.
A big part of this issue is the way each IT group measures their performance. Typically, it goes like this:
- Application Team : They look at software processes and talk in terms of Hit Ratios and Wait events with/without idle time stats.
- Server Team : They care about server performance (hardware & virtual) and stats around CPU, Memory, Disk and VM resource allocation
- Network Team : They monitor utilization, network errors and VLAN allocations to ports
The point being that everyone focusses on their elements, and no-one is looking at the one thing the users care about; how quickly does stuff turn up on my PC?
There is no doubt that all the above metrics, and many more as well, do affect data delivery times but none of them are a direct measurement of the only metric that really counts, response time.
A sure-fire way to get yourself a room full of disbelievers in the office is to listen to woes about the speed and utter the line “nothing to do with me” whilst pointing at a dashboard of green KPIs.

The Challenge
If you want to start measuring response time there are still some challenges ahead, with a few different ways of nearly doing it and a couple of ways which are pretty close.
Synthetic Requests
One of the more cost-effective methods is to install a probe or agent in the network, point it at your key services (local or hosted) and set it to make requests every few minutes. Over time you’ll get a graph displaying the responses - either the graph is flat (happy days) or lumpy (not so good).
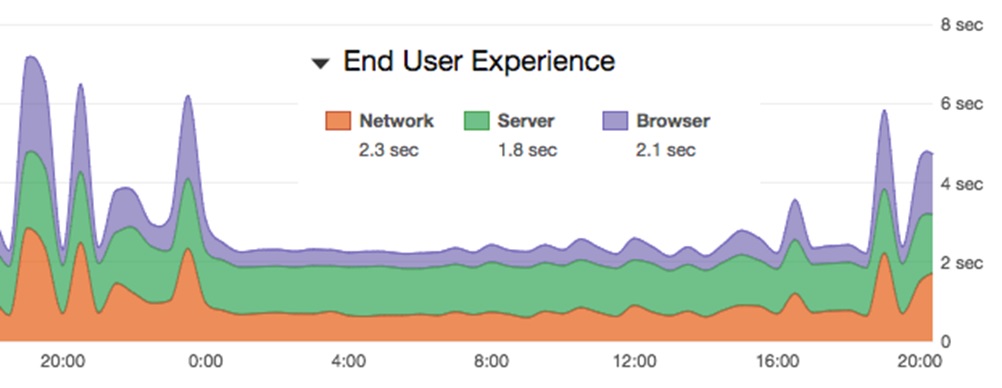
Most solutions will break this response time down into a few basic steps to help diagnostics such as:
- DNS time to resolve the url
- Network connection time to set up a TCP connection
- Webpage response time
There can be more steps of course, but these are the basics and not a bad place to start your diagnostics. For applications such as O365, connections are going to be made to the live service all the time, so when your synthetic requests run you can correlate the results with the live user experience.
But correlate is the right word, the issue with such solutions is that they are not looking at live requests being made, they are making fake requests at (hopefully) the same time as your live users, and betting on any issues affecting the live users will also affect the synthetic requests.
The advantage of these solutions is that they are relatively quick and easy to deploy. In complex deployments such as O365, the first question you want answered is “if there is any delay, is it in our network, the WAN supplier or the hosted environment?”, and these solutions do provide a good insight.
 We use a bit of technology from AppNeta - it monitors the path through your network, the WAN carrier’s efficiency and then sends synthetic requests to the urls of your hosted services - hence taking on multiple parts of the delivery process.
Agent Based Solutions
Agent based solutions have the advantage of looking at “real” requests from the users by adding some form of monitoring agent, typically bound to the NIC card drivers. The requests being made are monitored, plus the replies coming back. These results are then sent by the PCs to a central processing console (server) for analysis & reporting.
The challenge these technologies face is one of influencing their own results. The agent must use some resources and the data has to be sent to the console for processing, so effectively you are influencing the environment you are trying to manage. As time moves on these agents are getting more lightweight and the PCs more powerful, so this issue is reducing but the objections remain.
Further challenges are the effort it takes to roll out and install all the agents, plus covering all your PCs can mean a hefty license bill. Then there are the hosted services which you don’t own, how are you going to put an agent on an Azure VM?
This type of solution tends to be popular with Server teams as it contains things they understand; a client that needs to be rolled out, a server and database to build that collects data, and response times compared with the resource’s information on the PCs / server hardware.
APM – Application Performance Monitoring
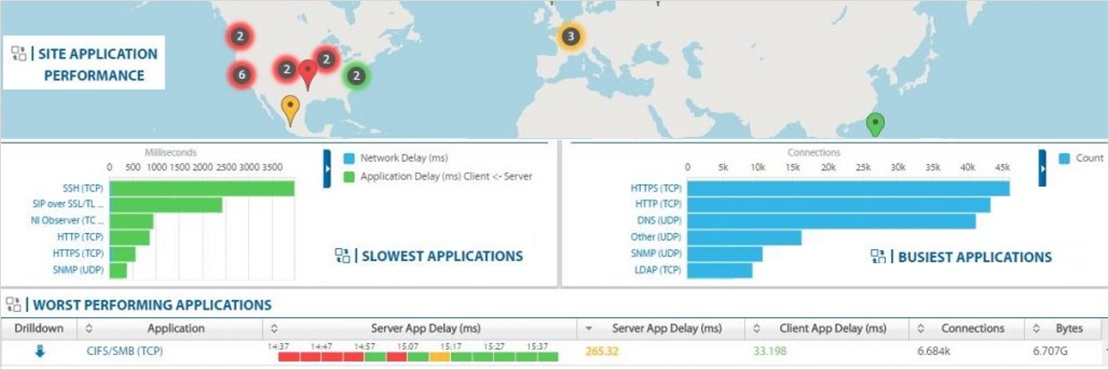
These solutions monitor the packets in the network layers and use timing algorithms to review requests/replies and work out what’s going on. This is achieved by installing probes in the network which see a copy of the traffic, so stay out of the live data paths. The packets are then processed to work out the performance metrics and reported to a central reporting engine.
The data is trusted and accurate. Network team tend to like this sort of technology as its based around parameters they understand; packets, TCP flows and SPAN ports.
The good news about these solutions is they don’t influence the live environment, and don’t require anything to be installed on the PCs and Servers. Should they fail, they are out of band, hence won’t impact the live system.
The challenge is that solutions like this have to process millions of packets every minute, hence there needs to be some serious hardware involved, which means serious cost too.
There is also the question of where to place the hardware, if you have multiple server farms and routes off site to hosted services, then in theory you need to monitor at all these points to see what’s going on.
The better solutions can then set SLAs based around the all important response time metrics, which in real terms means you get advised about slow response times and not just when the service failed completely.
If your business is dependent on a specific application set then maybe this is something you should consider, but as a general rule email and the internet don’t fall into this category!
Being network people we like the packet based solutions. We recommend Allegro : straight forward and easy to use capture solutions, with APM measurements for the key Microsoft and Database applications.
Summary
In summary, be aware of what you measure compared to what the users are telling you. The same goes for your colleagues in the Server and Application teams, everyone tends to monitor what they worry about which often leads to some gaps in the story. You may or may not want to spend money to plug some of those gaps. In business-critical situations our advice is that although a full set of green icons on a KPI board is a good thing, it’s not everything.