How Do You Monitor a Hosted Application?
With the rise in hosted applications there is an increasing need to understand how well these applications are being delivered to the users.
The challenge begins with the assumption that nothing will go wrong now it’s hosted and you’re in the hands of experts, rather than you’re over worked, under-funded IT team. The reality sometimes proves rather different; the same issues you had before usually reappear but now there are third parties to deal with and more places to shift/hide the blame.
There are ways of approaching this and the first thing to say is don’t assume the hosted supplier has any better information than you. Typically, they’ll use SNMP style tools to check memory, CPU & processes, and if those are OK they may report it’s not their problem.
Facing your WAN supplier can be a similar result when queried. Often simple utilisation style statistics are offered, claiming this is proof that everything is fine. Again, don’t be fooled by that either.
Here is our guide.
Let’s split it into three parts
1) The hosted Data Centre
This is probably the most complicated bit of the hosted application – starting with the design at the DC which may be a lot more difficult than you realise. Your requests will hit a pile of load balancers, routed to different locations and then through multiple file firewalls, before hitting a virtual design of firewalls, server clusters and databases too. It’s very challenging to monitor someone’s transactions from end to end. The amount of proxy IP addresses used in these designs makes troubleshooting specific requests very, very difficult.
2) The WAN carrier
This will depend on the WAN service you buy, but typically its either some sort of broadband service or an MPLS link. If its broadband, then the issues you face range from bandwidth contention through to latency issues. If you pay extra for MPLS circuits, the service tends to be more stable but bandwidth can still be a concern. The first thing people do when they suspect problems with the WAN is up the speed of the service, however if you don’t address any contention or latency problems, then things may not improve.
3) Your LAN network
This is the bit you know and understand the most, and also probably the simplest part of delivering these hosted services. However, it won’t stop the people supplying your hosted service and WAN networks from questioning whether your network is the cause of any problems - hence you may be forced into investigating. In reality the two areas you need to keep an eye on are the Firewalls and the Proxy’s. Whilst these do have the potential for slowing things down, the rest of your network is unlikely to have much affect here.
Have some way of measuring delivery times
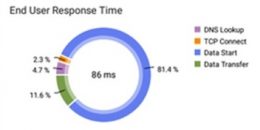
Time is the only thing the users care about. Someone in a DC saying their CPU and memory levels are fine is not enough. Other factors affecting delivery times are shared resources, jitter, latency, application turns ratios, DB look up, number of threads etc etc. Very few solutions look at all these factors and for good reason, its complicated stuff and if for 99% of the time it works, people have better things to do. The most important thing here is that the page or data turns up consistently within an acceptable time to the end user location, so measure that first and worry about all the details later.
Don’t assume suppliers have much more than utilisation statistics for their service
We’ve walked into a number of Data Centres hosting thousands of different peoples’ applications and it’s often monitored on freeware polling solution, which updates every few minutes and not much more. If you think you’re being fobbed off, ask for the metrics and see if they offer anything more than utilization stats for CPU, disks and memory of the virtual environment. If they have more information than this then great, but many DCs just don’t - hence beyond the basic metrics, they’re just guessing like you.
Look for devices being shared by a number of different resources
This can be the real problem with hosted applications in large DCs. The technology relies on shared kit handling 1000’s of requests from different companies through Firewalls and Load Balancers which are continuously proxying your connection.
Keeping a tab on individual connections is just not possible in these environments, what they look for this is the loading across the whole device and to try and keep this within acceptable limits. Dropping the odd TCP connection is not going to cause any alarms to ring, and no one cares unless it happens to be your request that’s been dropped.
The whole concept of busy also needs to be rethought. Typically, people think of busy as an interface or resource that’s getting near 100%, but in these environments that’s not always a good judge for what’s going on. As resources are often supporting thousands of connections per second from multiple clients, dropping 0.1% of requests might sound good but in reality, this could be several 100 failed attempts each hour. You need to understand the scale of events here to put the error rates into context.
Products that can help
AppNeta
Specifically designed for gathering metrics for web and hosted Applications.
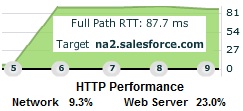
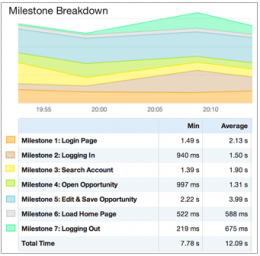
It monitors response times from any location, including measuring multiple steps a user may perform (such as logging in, opening or updating a record) to check the performance of each milestone.

Allegro Network Multimeter
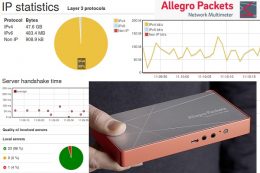
Install the probe behind your Router and record the detailed packet streams on and off site. Allegro have a range of sizes depending on your connection speed and memory requirements.
Set alerts and go back in time to view any issues.
NetAlly EtherScope nXG
A hand-held troubleshooting tool that can test the response times to hosted pages from the desk top.


